Exploring Overture data, no SQL required

· 3 min read

Overture has launched a new browser-based tool to give users a no-code option to interact with our data. The Explore website is now the quickest way to get started with Overture, no SQL required: https://explore.overturemaps.org
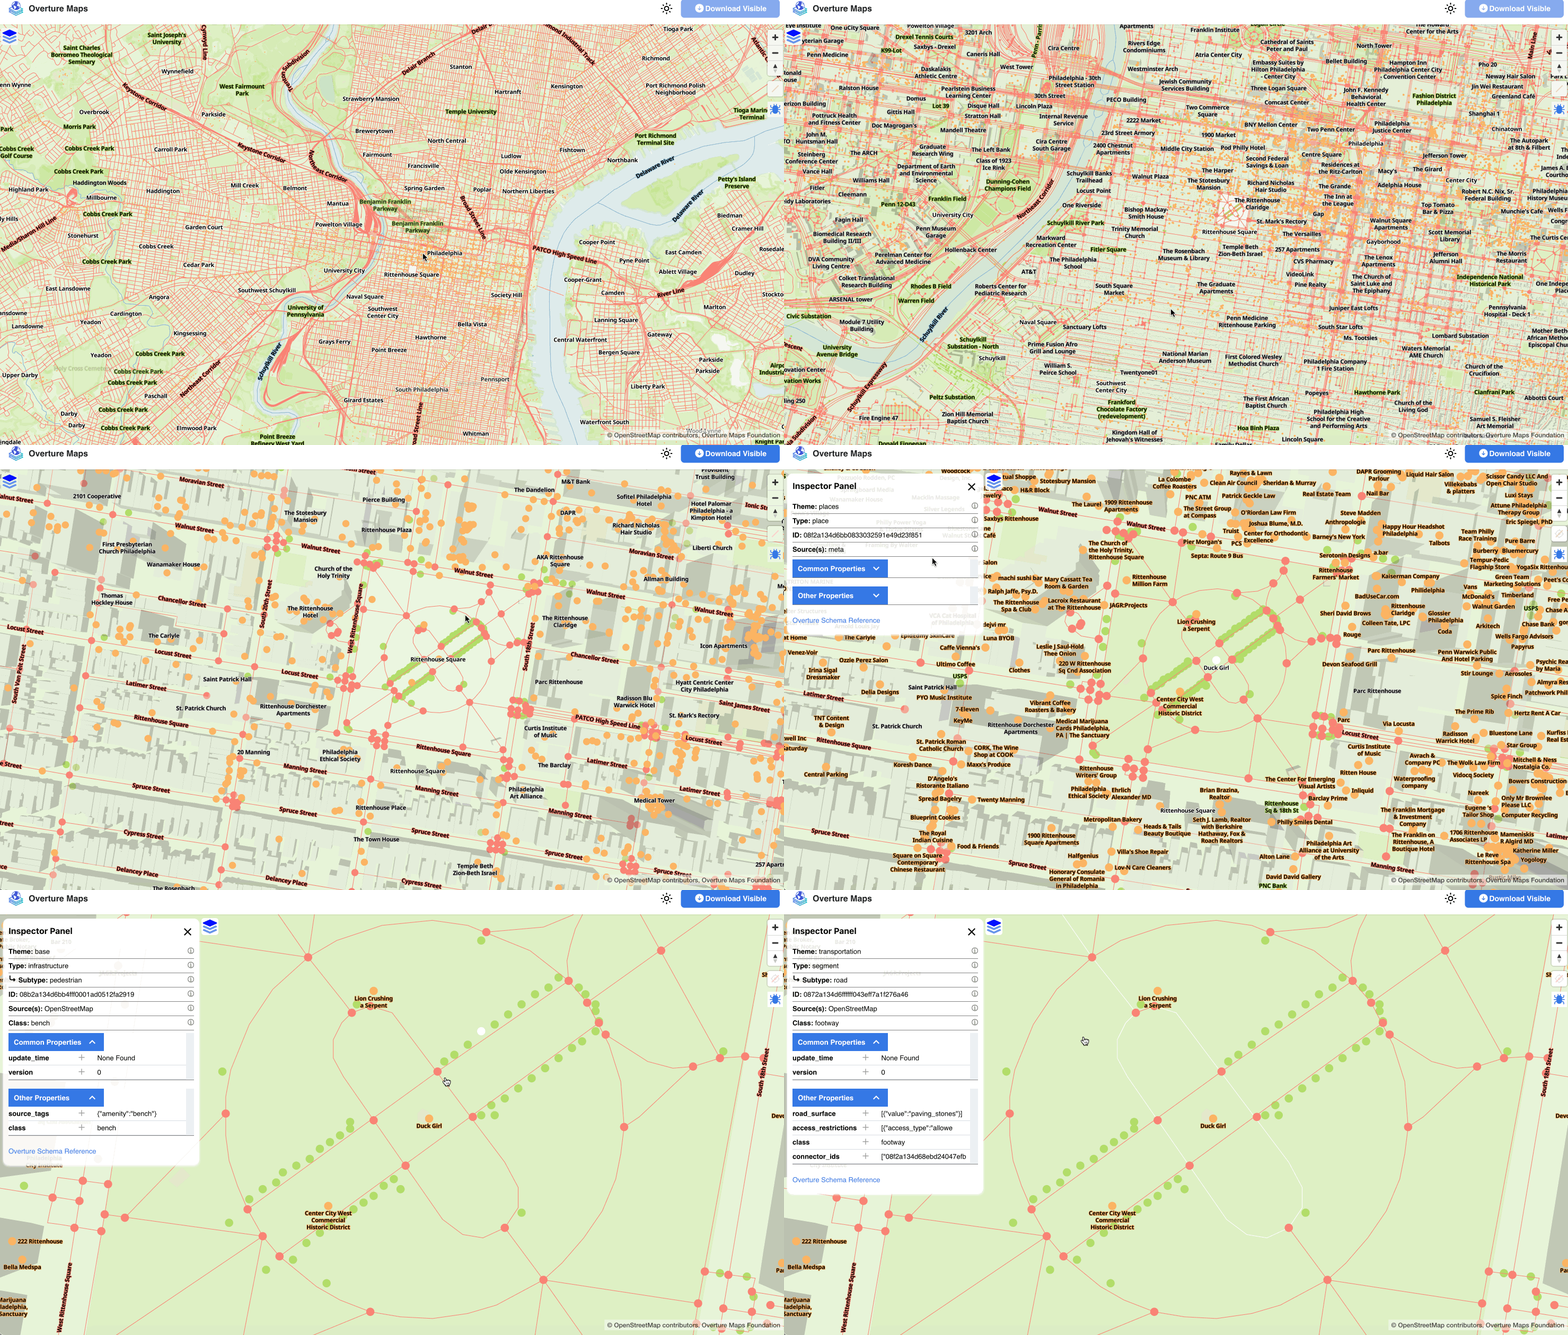
Exploring Philadelphia
Checking out "Lion Crushing a Serpent" in Philadelphia’s Rittenhouse Park

Not a map

The Explore tool might look like a map, but we prefer to think of it as an x-ray data inspector. We’ve punted on making cartographic decisions in favor of displaying all of Overture’s themes, all at once: addresses, base, buildings, divisions, places, and transportation. Our users are coming at the data with different perspectives and goals, and we want to provide as much information as possible. We also want to stoke your curiosity and inspire you to ask new questions of Overture data.

Seeing all the data all at once might be a bit overwhelming. We recommend zooming to an area of interest, hovering over the layers icon in the upper left corner of the map, and toggling the data themes off and on. You can click on an individual map feature, like the famous "Lion Crushing a Serpent" statue, to inspect its properties. Want to download the data? In the upper right corner of the Explore site, you can click on the Download Visible button to generate a GeoJSON file containing all the data visible in the browser.

The Explore site is currently in beta, and your feedback will inform the features we add in the coming months. If you have questions about the data, or if you want to report a problem with data quality or a glitch in the website, please click on the bug icon and file an issue on GitHub. (Note: we are actively working on fixing known issues with the downloaded data.)

Build with us

This project grew out of the diverse experiences and skill sets of the engineers working on Overture. We’re using WebAssembly and Rust, specifically geoarrow-rs, to query and download Overture’s GeoParquet files. The front end is React and Maplibre, and we’re generating PMTiles to visualize the data. It’s a serverless site, using all cloud-native data storage formats. We also plan to make PMTiles available with each Overture release. Special thanks to Kyle Barron from Development Seed and Brandon Liu from Protomaps for collaborating with Overture's Developer Advocacy team on this project.

Explore is open source, under an MIT license, and we welcome contributions from the Overture community. Our goal is to give you the basic building blocks for creating your own tools around Overture data. Let us know what you make and we’ll happily share it on our community projects page.
Land cover is live

· 3 min read

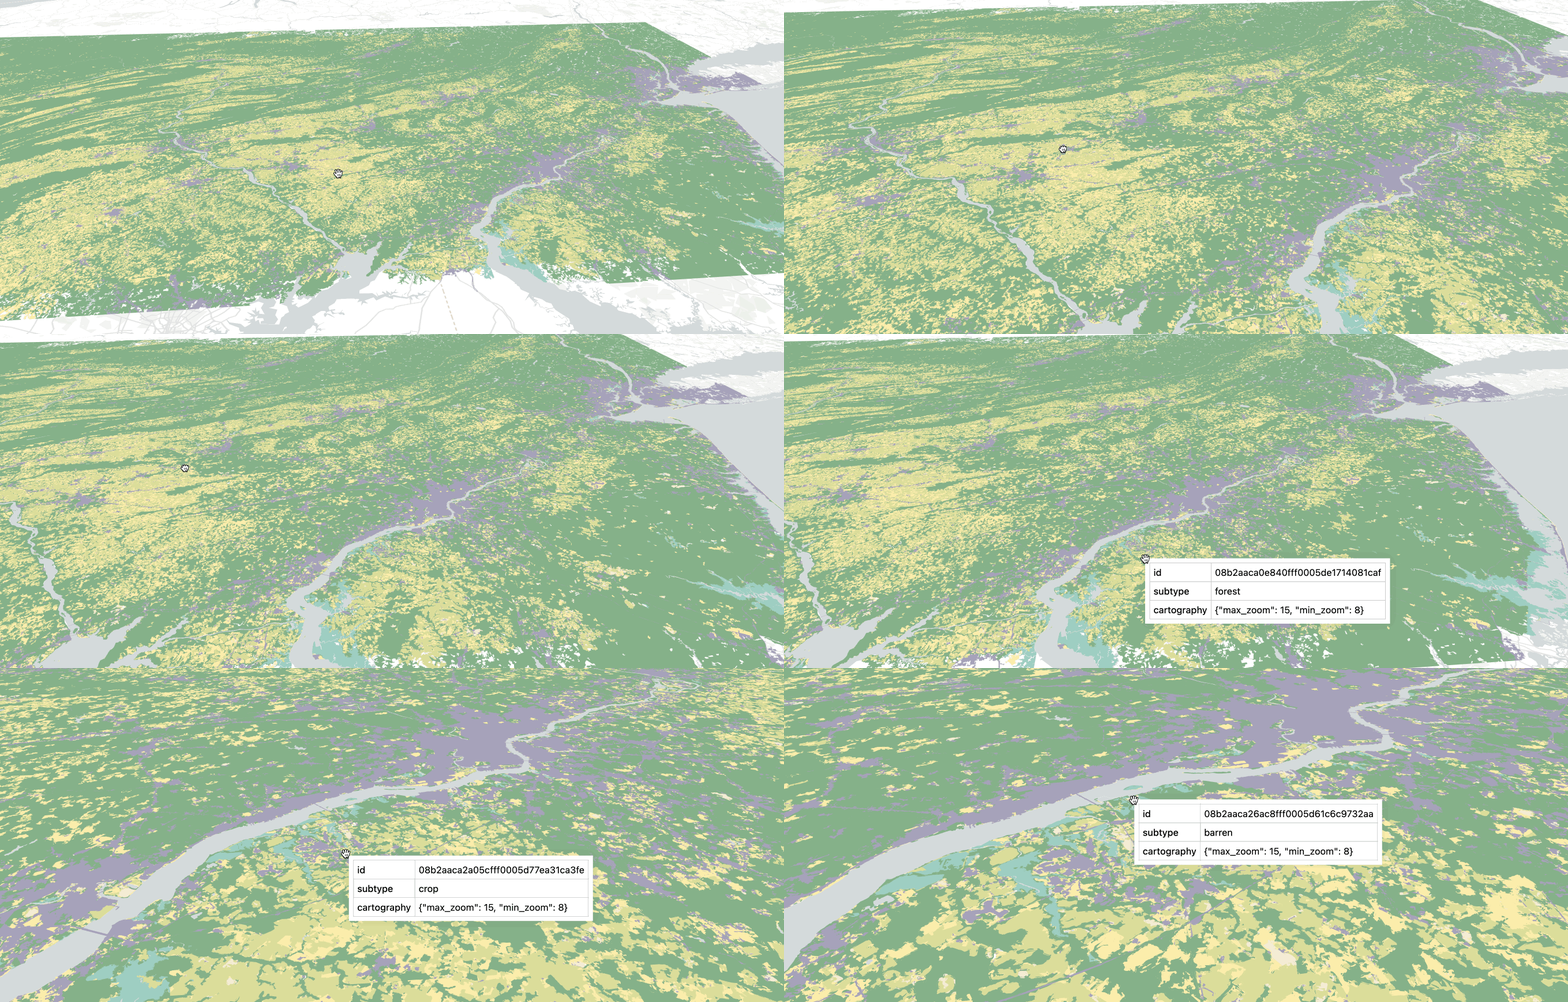
land cover gif

Mapmakers rejoice!

The May release of Overture Maps includes new high-resolution land cover data and new cartographic schema properties.

Our land_cover layer is vectorized data derived from the European Space Agency’s 2020 WorldCover (10m) rasters. It's similar to the land cover layer in the Daylight map distribution, but Overture Maps added higher-resolution data (zoom level 15) with more detail and land cover classes. You'll find 10 subtypes in the new data: snow, forest, urban, grass, crop, barren, wetland, moss, mangrove, and shrub.

Our May release also includes schema properties that offer cartographic "hints" for optimal use of Overture Maps data in mapmaking. We added min_zoom and max_zoom to define the recommended zooms for each resolution of land cover, using the common “slippy maps” zoom level specification. This is a first step toward improving the user experience for mapmakers. We plan to expand these properties in future releases of Overture Maps data.

Exploring land cover

In the notebook example below, we'll show you how to extract, process, and visualize land cover data for an area of interest using lonboard and the Overture Maps Python command-line tool. We recommend that you consult this example in the lonboard docs to better understand the methods used here. You can view and download the complete notebook on Notebook Sharing Space.

land cover

To follow along, you'll need to have JupyterLab or Jupyter Notebook running and the following dependencies installed:

import pandas as pd
import geopandas as gpd
import overturemaps
from shapely import wkb
from lonboard import Map, PolygonLayer
from lonboard.colormap import apply_categorical_cmap
# specify bounding box
bbox = -78.6429, 39.463, -73.7806, 41.6242
# read in Overture Maps land_cover data type
table = overturemaps.record_batch_reader("land_cover", bbox).read_all()
table = table.combine_chunks()
# convert to dataframe
df = table.to_pandas()
# filter for higher resolution land_cover features
df_h = df[df.cartography.apply(lambda x: x['min_zoom'] == 8)]
# create color map for land_cover subtypes, loosely based on natural-color palette: https://www.shadedrelief.com/shelton/c.html
color_map = {
"urban": [167, 162, 186],
"forest": [134, 178, 137],
"barren": [245, 237, 213],
"shrub": [239, 218, 182],
"grass": [254, 239, 173],
"crop": [222, 223, 154],
"wetland": [158, 207, 195],
"mangrove": [83, 171, 128],
"moss": [250, 230, 160],
"snow": [255, 255, 255],
}
# apply color map to land_cover subtypes
colors = apply_categorical_cmap(df_h.subtype, color_map)
# dataframe to geodataframe, set crs
gdf = gpd.GeoDataFrame(
df_h,
geometry=df_h['geometry'].apply(wkb.loads),
crs="EPSG:4326"
)
# create map layer 
layer = PolygonLayer.from_geopandas(
gdf= gdf[['id','subtype', 'cartography', 'geometry']].reset_index(drop=True),
get_fill_color=colors,
get_line_color=colors,
)
#render map
view_state = {
"longitude": -76.2,
"latitude": 39.6,
"zoom": 8,
"pitch": 65,
"bearing": 5,
}
m = Map(layer, view_state=view_state)
m

Exploring our beta release

· 3 min read

Last week Overture Maps announced the beta release of our schema and data. After months of hard work and steady improvements, we are nearing production-level stability. In a series of posts over the next few weeks -- starting with this one -- we’ll unpack the highlights and improvements you'll see in this release and beyond.

Making geospatial fast

The first thing you'll notice is how much faster you can pull Overture Maps data out of the cloud. We made this possible by working closely with open-source collaborators on the repartitioning and spatial optimization of our GeoParquet files. Meanwhile, our friends at DuckDB, one of our favorite SQL tools, added a feature that improves the performance of queries with bounding boxes.

Query speeds have improved significantly from our February release to the April beta release. This example compares DuckDB queries for buildings in Philadelphia. See here for more information about our performance testing.
SELECT 
*
FROM
read_parquet('s3://overturemaps-us-west-2/release/2024-02-15-alpha.0/theme=buildings/type=building/*', filename=true, hive_partitioning=1)
WHERE
bbox.minx > -75.60154
AND bbox.maxx < -74.955763
AND bbox.miny > 39.867004
AND bbox.maxy < 40.137992;

820,915 buildings
~120s

We're continuing to make things faster and easier for users. Along with the folks at Development Seed, an Overture Maps Foundation member, we're building special tools for Overture Maps data on top of lonboard, their Python library for visualizing large geospatial datasets in Jupyter. And recently our friends at Wherobots took a comprehensive look at how our use of GeoParquet makes querying and analyzing our data with Apache Sedona very efficient.

As you can see, we're moving forward with the community to iterate on data, software, and specifications with the shared goal of making geospatial fast.

Easier-to-use schema

Another highlight of the beta release is the transition to an easier-to-use schema for our administrative boundary data. We first explored this idea with the Overture Maps community in February, and after two short months of work, the new divisions schema and data are ready to go. Here's a query to divisions that grabs geometries for all the countries in the world:

SELECT *
FROM read_parquet('s3://overturemaps-us-west-2/release/2024-04-16-beta.0/theme=divisions/type=division_area/*', filename=true, hive_partitioning=1)
WHERE subtype = 'country';

You can see that the divisions query above is much simpler than a comparable query to admins:

WITH admins AS (
SELECT *
FROM read_parquet('s3://overturemaps-us-west-2/release/2024-04-16-beta.0/theme=admins/type=*/*', filename=true, hive_partitioning=1)
)

SELECT *
FROM admins country_locality
JOIN admins country_area
ON country_area.locality_id = country_locality.id
WHERE country_locality.locality_type = 'country';

We plan to deprecate admins by the July release. In the meantime, both admins and divisions will be available to users.

Bridges, islands, waterfalls, and more!

We added more rich detail to our base layer in this release, including an infrastructure type with familiar features from Facebook’s Daylight map distribution. We also added new subtypes and classes for the land, land_use, and water feature types. You'll find a comprehensive listing of the subtypes and classes for each feature type in our schema reference docs. Ready to make your own map? We have a tutorial to help you get started.

Stay tuned for more highlights

We'll be back soon with more posts that explore our path from the beta release to production. In the meantime, we invite you to get started with our data and share with us your comments and feedback.

Welcome!

· One min read

Welcome to the Overture Maps engineering blog! We're excited to tell the technical stories behind this big, exciting, ambitious, intensely collaborative project we’ve been working on for more than a year. The engineers building Overture Maps are eager to connect with our developer community. In the posts we publish in the coming months, you’ll hear from team members who work at Amazon, Meta, Microsoft, TomTom, Esri, Development Seed, Precisely, and more. And we’d like to hear from you: feedback and contributions from folks working with our data and schema are crucial to our success. Thanks for joining us on this journey. We’re glad you’re here.