GERS Changelog
With each data release, Overture generates a GERS changelog to capture changes in the data tied to the unique ID for each feature. This information can be used to guide decisions about data matching, better understand data stability, and help detect data errors.
The GERS changelog is available as Parquet files — partitioned by theme, type, and change type — at the following locations:
| Provider | Location |
|---|---|
| Amazon S3 | s3://overturemaps-us-west-2/changelog/ |
| Microsoft Azure | wasbs://changelog@overturemapswestus2.blob.core.windows.net/ |
The latest path is:
2024-07-22.0/
Types of changes
The types of changes in the changelog include:
- added: the feature with this ID is new in the current release and was not present in the previous release
- removed: the feature with this ID is not present in the current release but was present in the previous release
- data_changed: the feature with this ID in the current release contains a change in geometry or properties from the feature with this ID that was in the previous release
- unchanged: the feature with this ID in the current release matches the geometry and properties of the feature with this ID that was in the previous release
Querying the GERS changelog
We can query the changelog with DuckDB to get a quick look at changes in data from the last release to the current release. In this example, we're grabbing ID, feature type, and change type for buildings in several towns across the Amhara Region in Ethiopia.
LOAD spatial;
LOAD httpfs;
SET s3_region='us-west-2';

SELECT id, type, change_type
FROM read_parquet('s3://overturemaps-us-west-2/changelog/2024-06-13-beta.0/theme=buildings/type=*/change_type=*/*', filename=true, hive_partitioning=1)
WHERE
        bbox.xmin > 37.165914
        AND bbox.xmax < 37.902271
        AND bbox.ymin > 10.221917
        AND bbox.ymax < 10.751245;
We can also get a count of building features by change type for our area of interest.
LOAD spatial;
LOAD httpfs;
SET s3_region='us-west-2';

SELECT count(*), change_type
FROM read_parquet('s3://overturemaps-us-west-2/changelog/2024-06-13-beta.0/theme=buildings/type=*/change_type=*/*', filename=true, hive_partitioning=1)
WHERE
        bbox.xmin > 37.165914
        AND bbox.xmax < 37.902271
        AND bbox.ymin > 10.221917
        AND bbox.ymax < 10.751245
GROUP BY change_type;
Taking this one step further, this time using Athena to run our query, we can join the changelog and data via Overture ID to connect the change type and feature geometries and properties.
SELECT release.id, release.names.primary AS primary_name, release.sources[1].dataset AS primary_source, change_type, ST_GeomFromBinary(geometry) AS geometry
FROM v2024_06_13_beta_0 AS release
        INNER JOIN changelog_v2024_06_13_beta_0 AS changelog ON release.id = changelog.id
WHERE release.theme = 'buildings'
 AND release.bbox.xmin > 37.165914
        AND release.bbox.xmax < 37.902271
        AND release.bbox.ymin > 10.221917
        AND release.bbox.ymax < 10.751245;
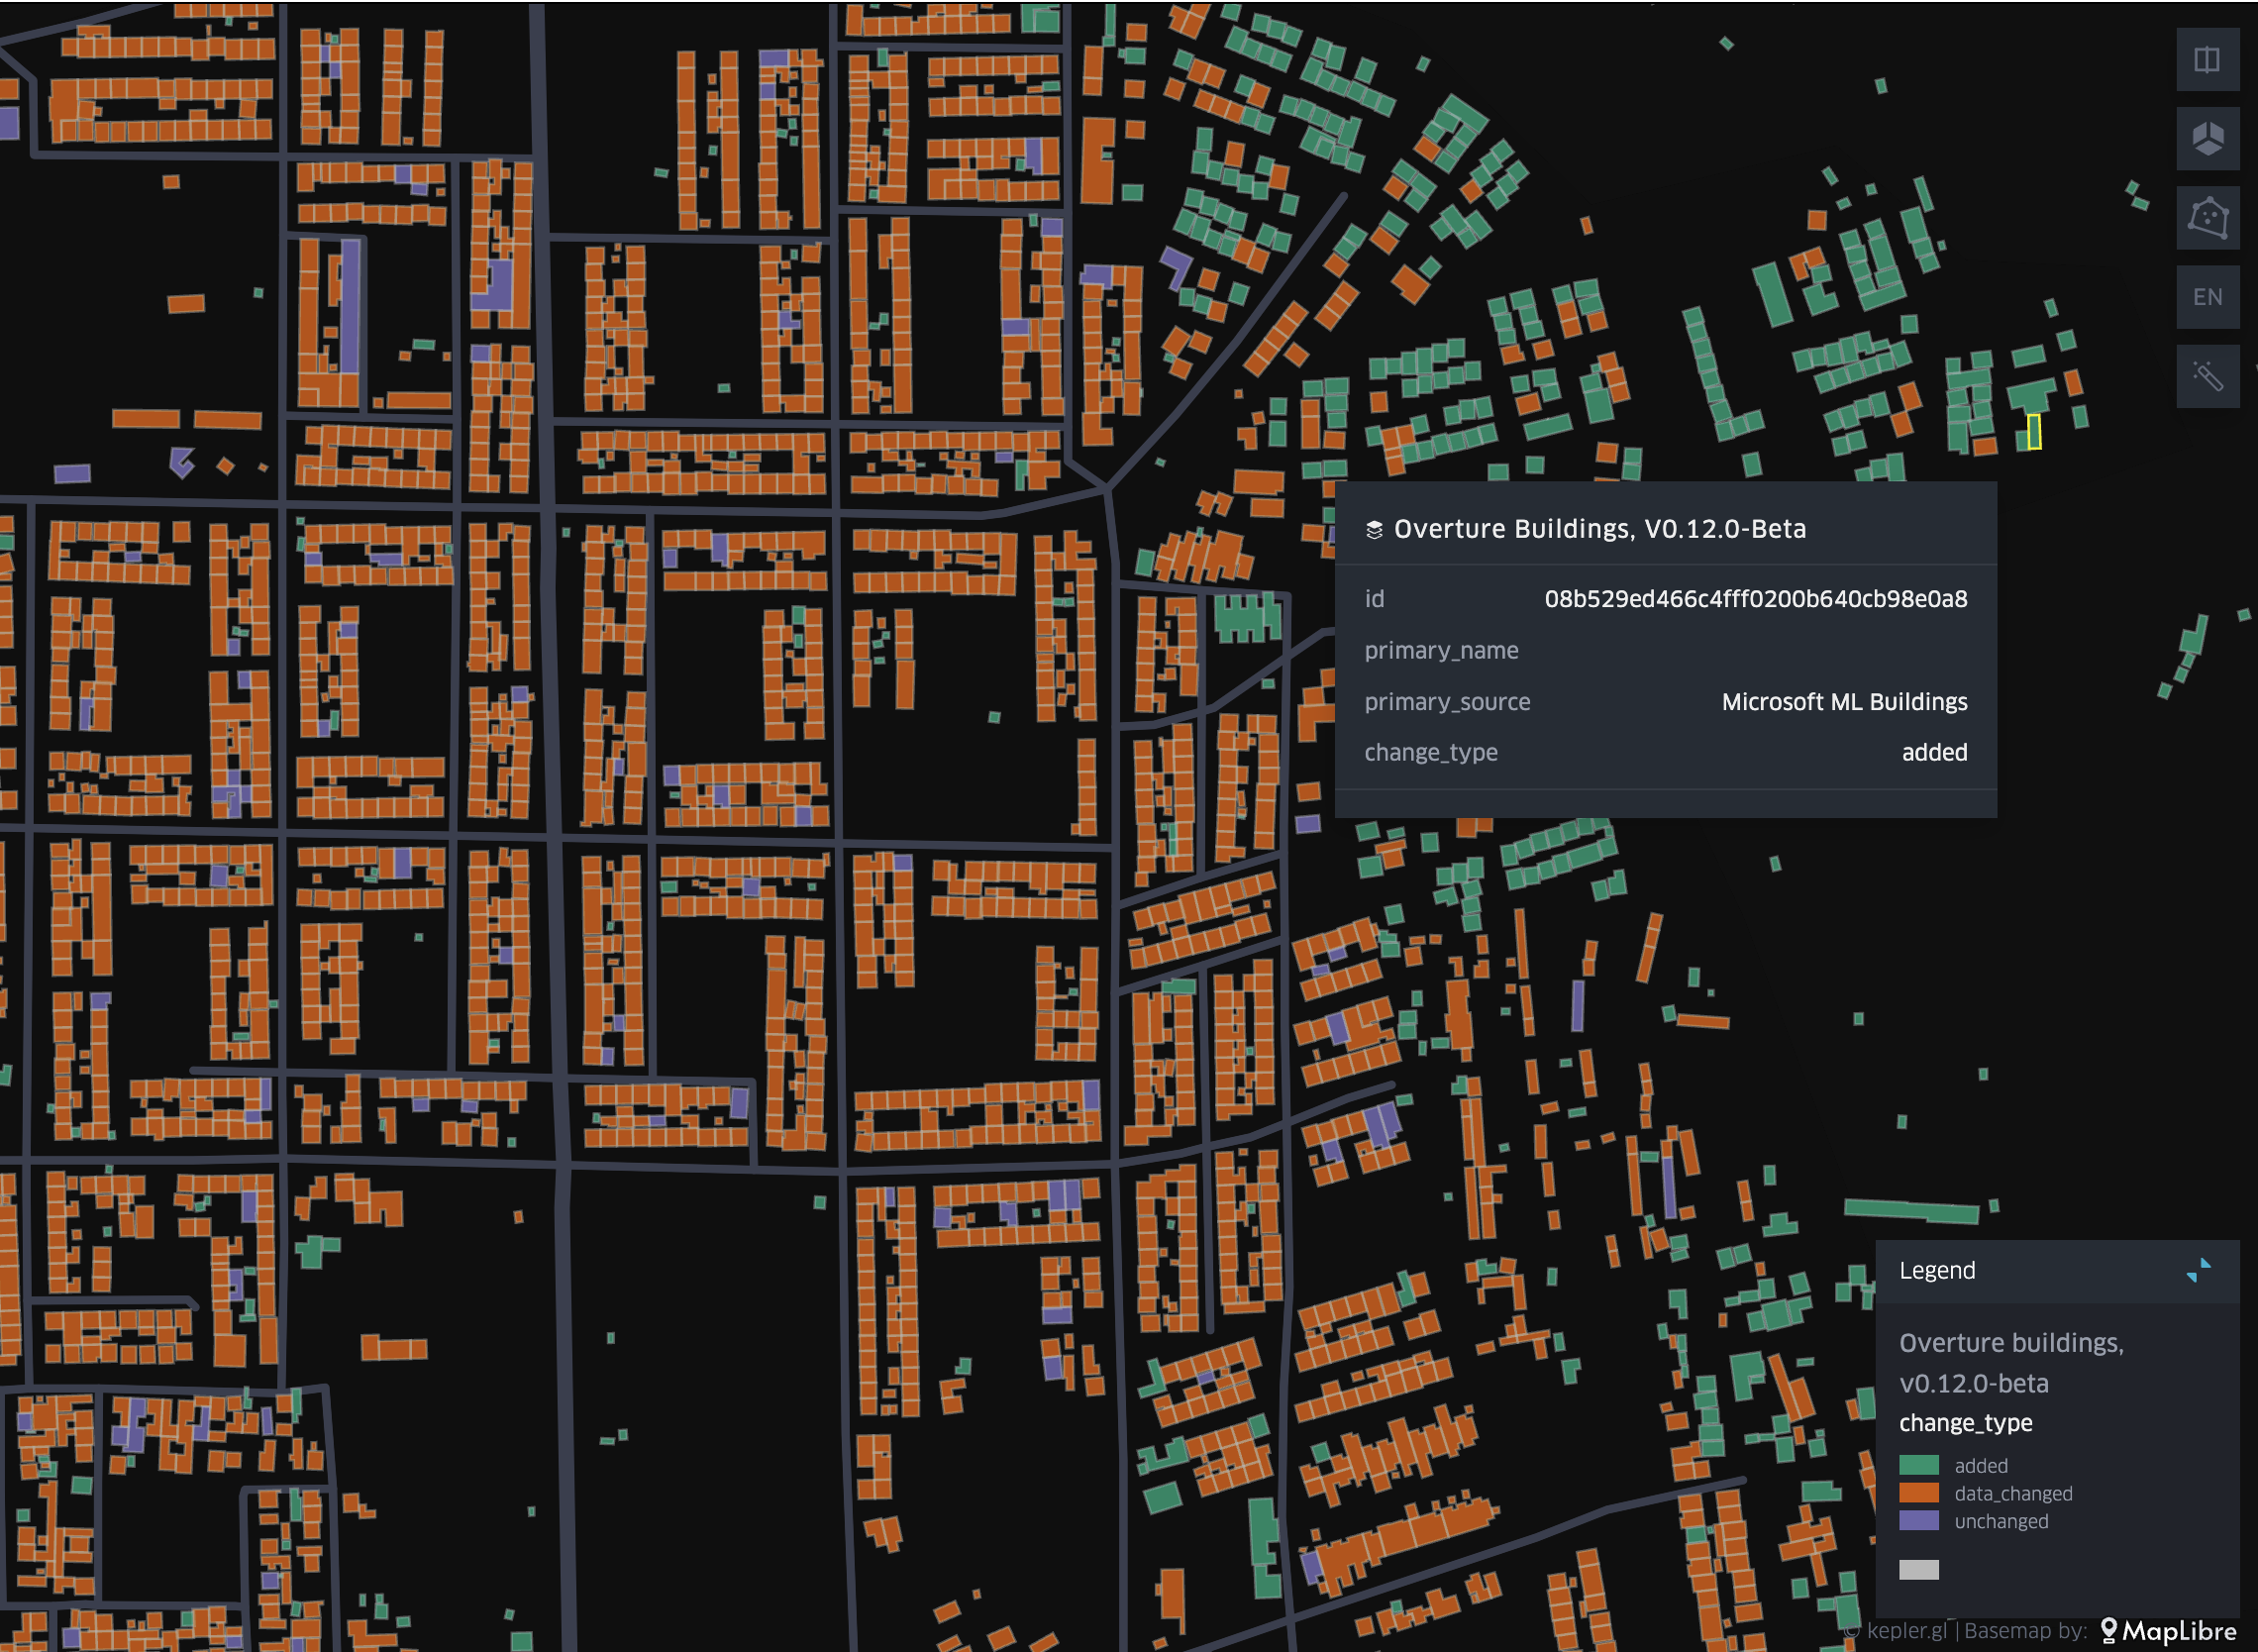
Finally we can use the results of our query to visualize building features by change type and inspect the properties for each feature. The example below, created using kepler.gl, shows buildings in Finote Selam, a city in the Amhara Region of Ethiopia. The data is from Overture's 2024-06-13-beta.0 release, to which we added 100 million new buildings, many of them derived from satellite imagery by Microsoft.